Table of Contents
Curious about who’s visiting your Portfoliobox portfolio website? The Website Analytics tool gives you a clear overview of how your portfolio performs; helping you understand your visitors, their behaviour, and what captures their attention.
How to access your website analytics
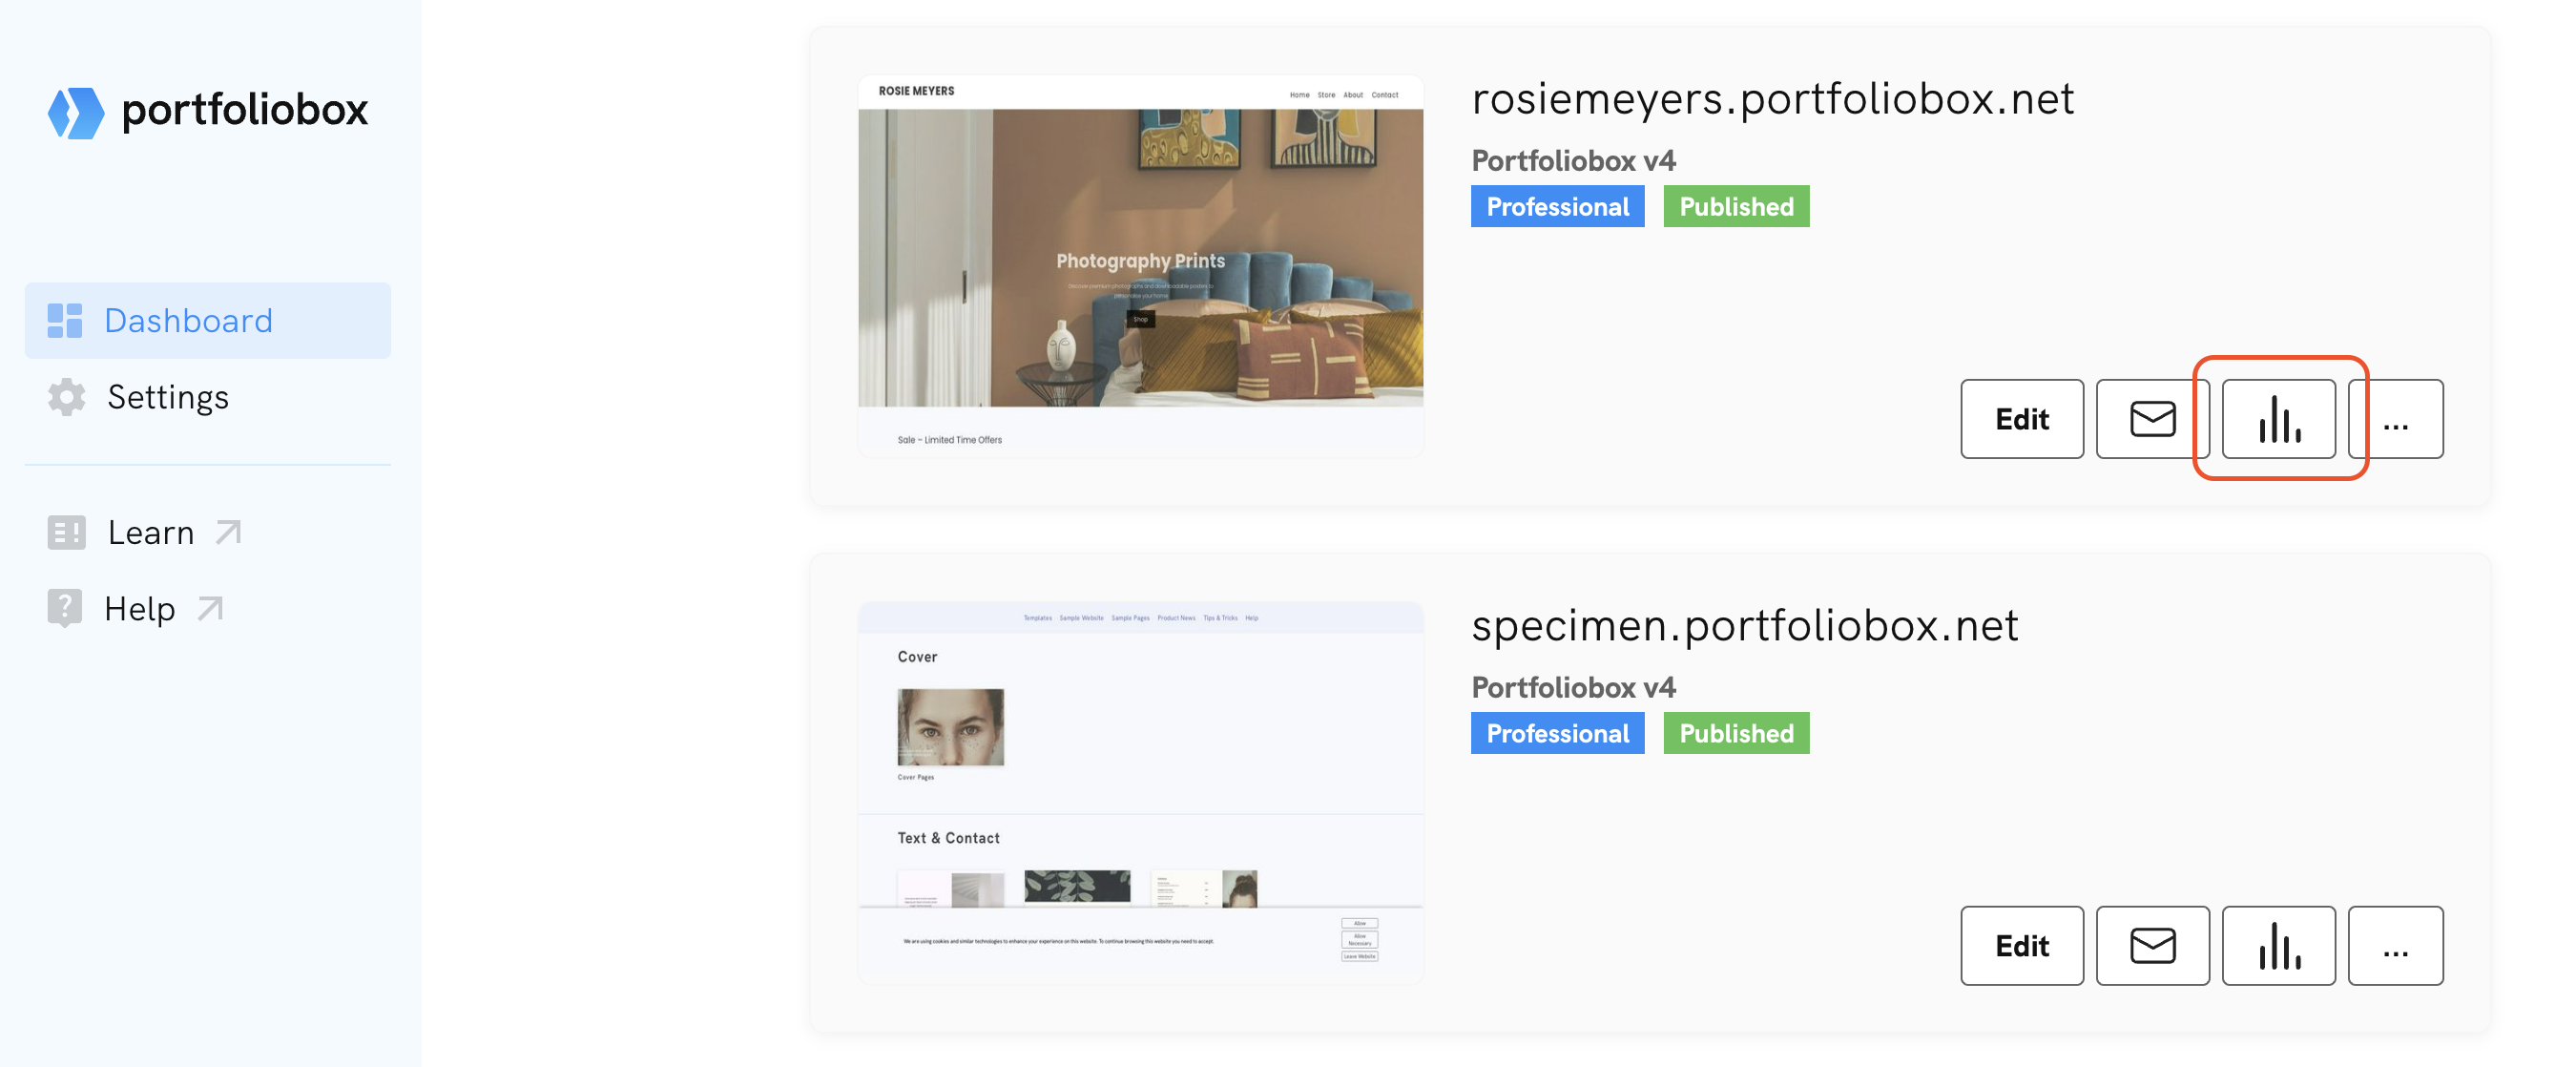
In your dashboard, click the analytics icon linked to your website, next to the envelope icon.
Here’s a breakdown of the key data you’ll find:
Total visits
The total visit count shows the number of times your website was visited during a specified period. If someone visits your site multiple times, each visit is counted, but only once per day per person. This means if the same visitor returns later the same day, it still counts as one visit.
Total pageviews
This counts the number of times any page on your portfolio was loaded. One visitor can generate multiple pageviews, especially if they explore several sections of your portfolio.
Daily visits
You can view a line graph showing your total daily visits. It helps you identify patterns, such as spikes after sharing a new project or running a campaign.
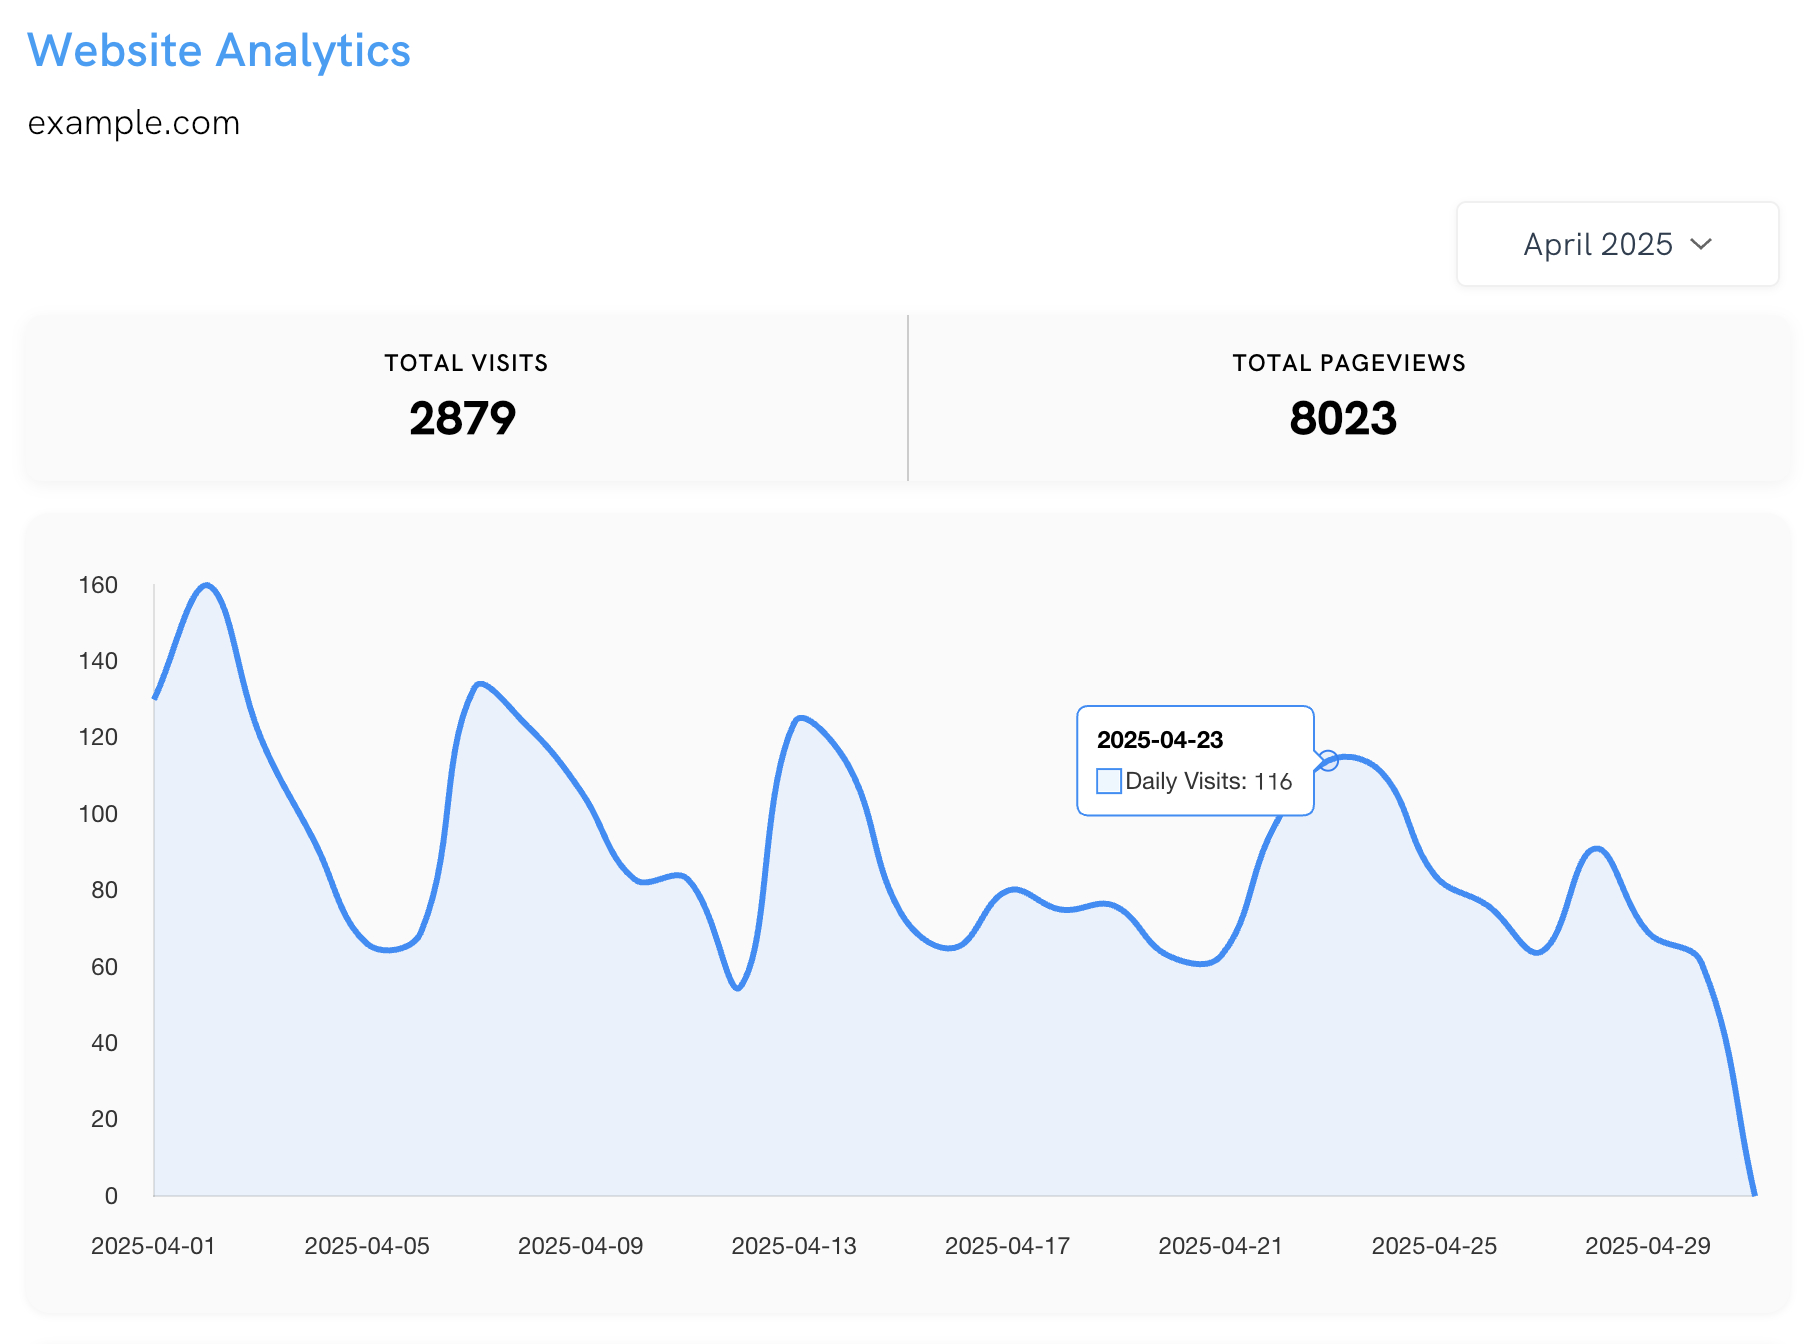
In the example above, the website example.com received 2879 total visits and 8023 page views in April 2025. On 23 April 2025, there were 116 visits.
Top pages
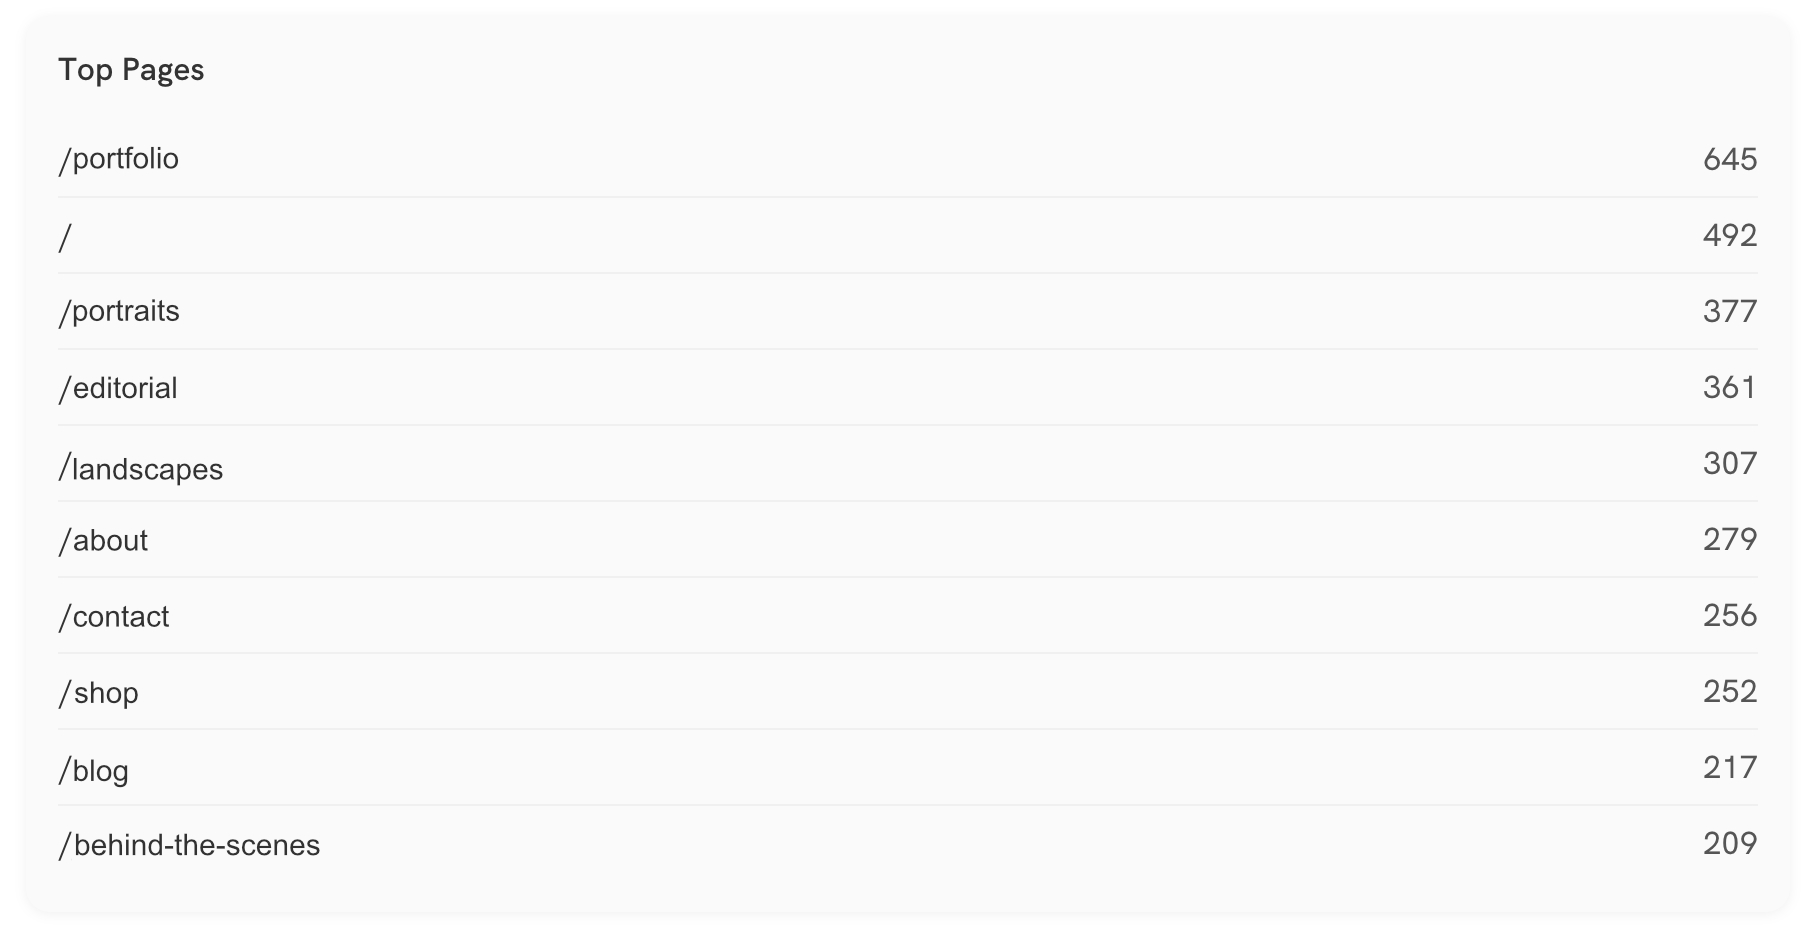
This indicates which page of your portfolio received the most attention. This list shows the 10 most-visited pages of your website. According to the example below, the portfolio page (shown as "/portfolio") received 645 visits, indicating that it’s the most viewed page during the selected time period, followed by the homepage (shown as "/"), and others.
Devices
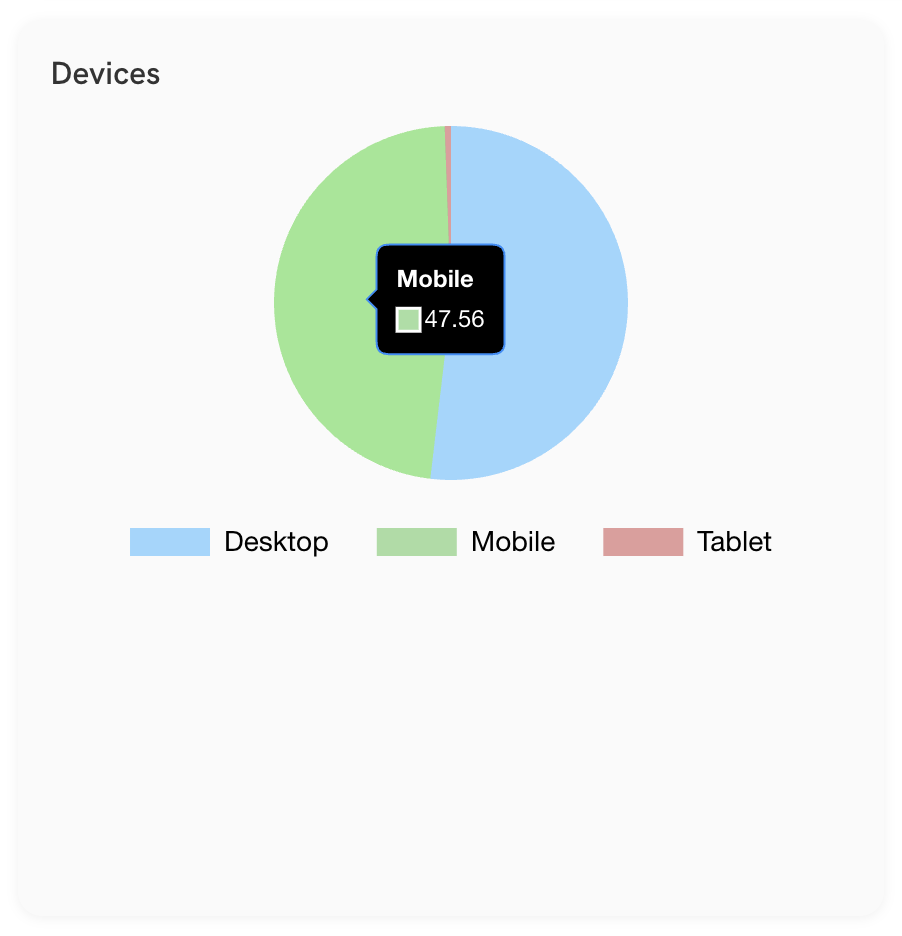
See what type of device your visitors are using. This helps you make sure your portfolio looks great on both desktop and mobile. From the example below, we can see that 47.56% of users accessed the website using mobile devices during the selected time period.
Top countries
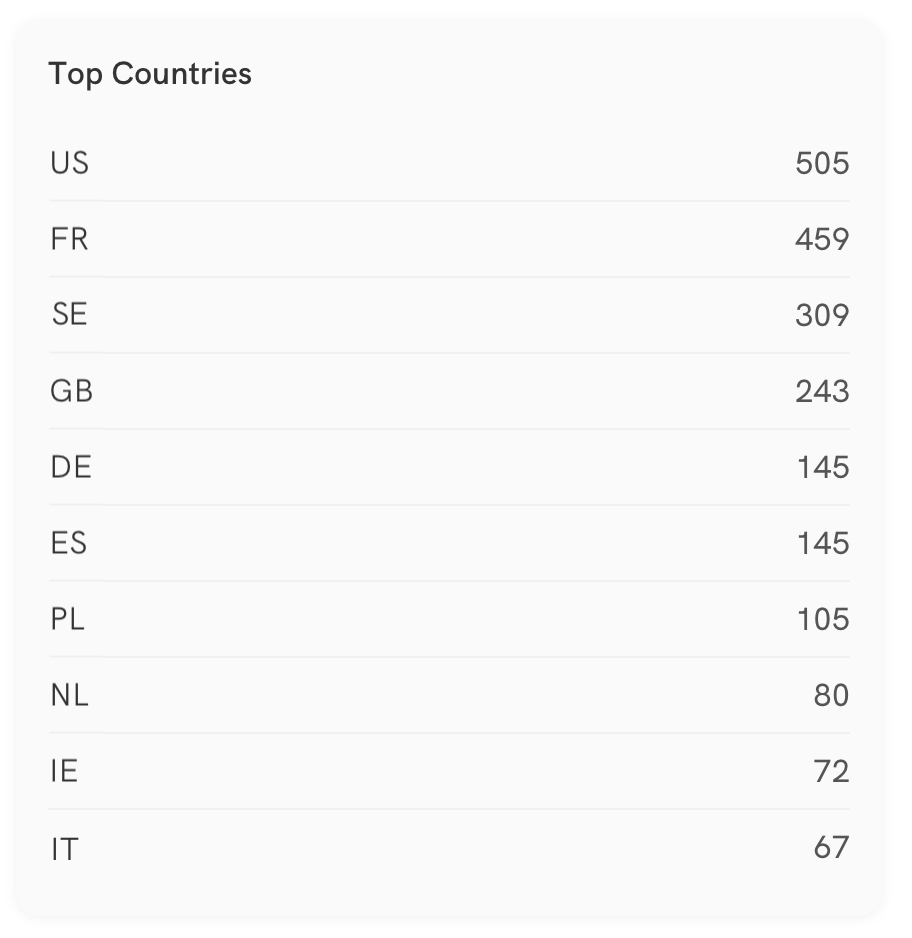
Find out where your visitors are coming from! The top 10 countries are listed, along with the number of visits each received. Over the selected period, this website has received the most traffic from the United States (US), followed by France (FR), Sweden (SE), Great Britain (GB), and others.
Analytics FAQ
What are pageviews, and how do they differ from visits?
Pageviews count how many times any page on your portfolio was loaded. A single visit can include multiple pageviews if the visitor browses around.
Can I see which countries my visitors are coming from?
Yes! The analytics section shows the top 10 countries where your visitors are located, along with the number of visits from each.
How accurate is the visitor data?
The data is based on anonymised session tracking and reflects unique visits and behaviours across your website. While it's not as detailed as third-party tools, it gives a reliable overview.
Are my visitors’ personal data stored?
No. All sessions are fully anonymised. We never store IP addresses or any personal data. Session IDs are generated using a hash (a one-way code that turns data into a short, unique string) of the visitor’s IP address, browser details, and a daily random value, without using cookies or tracking IDs. This is also why each visit counts as unique only once per day.
Which pages are getting the most attention?
The "Top pages" section lists the most visited pages on your portfolio, so you can see what’s drawing the most interest.
How can I get more detailed analytics, like time on page or user behaviour?
For deeper insights, such as the duration of visitor stays, the buttons they click, or their navigation through your portfolio, you can integrate your Portfoliobox website with Google Analytics. This third-party tool offers a more detailed view of your audience and their behaviour.
How often is the data updated?
The analytics dashboard is updated daily, so you can track changes and trends over time.
What devices are my visitors using?
Your analytics will show a breakdown of device types—desktop, mobile, or tablet—so you can understand how people are viewing your portfolio.
Can I export my website analytics?
Currently, it's not possible to export the analytics data.
Why can't I see my website analytics?
Website analytics is available for the Professional plan only.
Does tracking happen before the visitor clicks “Accept Cookies”?
Yes. Since the analytics are cookie-less and fully anonymous, visits are registered as soon as the page loads—no cookie consent is required.


